

全部商品分類
-
- 品牌精選
-

-
- 品牌精選
-
-
- 品牌精選
-


|
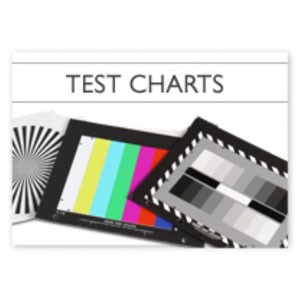
透射式德國愛莎測試卡系列 Esser Test Charts
由成立于1998年TILO天友利專業代理,TILO是行業工商許可的數碼圖像檢測用照明光源的生產型企業,通過ISO9001國際質量管理體系認證。

★★★★★第31屆省港杯足球賽由天友利冠名贊助
★★★★★本公司通過ISO9001:2008國際質量管理體系認證
★★★★★本公司通過CE、RoHS、SCM等產品認證和檢測
No. Designation Available Data Sheets
| T01B T01B16:9 |
|
Geometry Test Chart / Ring TB (black surrounding) The T01 is designed to measure geometry of cameras and monitors. Circular rings are arranged in a grid in such a way that at ideal geometry their center points are located in the intersection points of a grid raster of lines of an electronic test generator (black surrounding). |
T01B A T01B 16:9 A T01B D T01B 16:9 D |
| T01W T01W 16:9 |
|
Geometry Test Chart / Ring TB (white surrounding) The T01 is designed to measure geometry of cameras and monitors. Circular rings are arranged in a grid in such a way that at ideal geometry their center points are located in the intersection points of a grid raster of lines of an electronic test generator (white surrounding). |
T01W A T01W 16:9 AT01W DT01W 16:9 D |
| T03 |
|
Depth Of Modulation 0.5 / 5 MHz The T03 is designed for evaluating the uniformity of the modulation depth of TV cameras. Between the line raster rows two white bars of different lengths are arranged on a black background (upper part) resp. two black bars of different lengths are arranged on a white background (bottom part). |
T03 AT03 D |
| T04 T04 16:9 |
|
Bar Test Chart (IEC 61146) The bar test chart is designed for checking the transmission characteristics of TV cameras at intermediate and deep frequencies. It consists of horizontal bars as white on black and black on white background pattern. |
T04 AT04 16:9 AT04 DT04 16:9 D |
| T05 |
|
Universal Test Chart (IEC 61146, DIN EN 50132-2-1, DIN 25435-4) The T05 test chart is designed for general (visual) appraisal of TV cameras. It consists of gray wedges, MHz line rasters and geometry circles. |
T05 AT05 D |
| T06 |
|
Chess Board Test Chart The T06 test chart is designed for checking geometry and resolution. It is composed of black and white square fields which are surrounded by rectangular fields at the edges that correspond to the grid raster lines of electronic test generators. |
T06 AT06 D |
| T06A |
|
Chess Board Test Chart The T06A test chart is designed for checking geometry and resolution. It is composed of black and white square fields which are surrounded by rectangular fields at the edges. With the aid of sector stars and horizontal resp. vertical line rasters resolution and back focal distance can be measured. |
T06A AT06A D |
| T07 T07 16:9 |
|
Multi Burst and Linear Gray Scale Test Chart (0.5-10 MHz, densities 0.15-1.65, s. Pflichtenheft 8/1.1) The T07 is designed for evaluation of the halftone reproduction and of the frequency response and the modulation depth of electronic cameras. It consists of a line raster and counter current gray scales. |
T07 AT07 16:9 A T07 DT07 16:9 D |
| T10A |
|
Scattered Light Test Chart 50% (IEC 84/60B) The T10A is designed to measure overall flare of camera systems. In the center of the chart is a black area surrounded by a white area in a way that the average picture level is 50%. |
T10A AT10A D |
| T10B |
|
Scattered Light Test Chart 99% (IEC 84/60B) The T10B is designed to measure localized flare of camera systems. In the center of the chart is a black area surrounded by a white area in a way that the average picture level is 99%. |
T10B AT10B D |
| T13 |
|
EBU Universal Film Test Chart (EBU Tech. 3087; Pflichtenheft 8/1.1) The T13 is designed for checking color and neutral gray reproduction, relative modulation depth, gradation and granularity of film material for television. On a neutral gray background three groups of test components (grays, colors, resolution patterns) are arranged within the picture-relevant area. |
T13 AT13 D |
| TE42 |
|
Forty Two This chart contains everything you need to measure the OECF, dynamic range (contrast limited to 1000:1), color reproduction quality, white balance, noise, resolution, shading, distortion, kurtosis. |
TE42 A |
| BBC61A |
|
Flesh Tone Reference Test Chart (BBC approved) The flesh tone test chart is designed for evaluating the flesh tone rendition of electronic cameras. The chart developed by the BBC London is a four color offset print. The spectral remission of the flesh tones approximates the natural flesh tone very well. |
BBC61A |
| T63 |
|
Zone Plate Test Chart The T63 is designed for checking resolution characteristics and cross color interferences of TV cameras and TV transmission systems. On a neutral surrounding area four large zone plates are arranged. Each zone plate consists of concentric circular rings, with their width and distances decreasing outwards. |
T63 AT63 D |
| BBC64 |
|
Color Camera Gray Scale Test Chart (with super black hole) The BBC64 is designed for the accurate adjustment of camera flare corrections and setting of black level. Two 9-graduated counter current gray scales are arranged on a gray background. The gray scales being graduated logarithmically (gamma = 0.45). |
BBC64 |
| BBC65 |
|
Studio Camera Line-Up Test Chart (with super black hole) The BBC65 is designed to be used in conjunction with the test chart BBC6 A Flesh Tone Reference when very close color matching is required. BBC65 was developed to fulfill the need for a simplified studio test chart giving only the necessary information for routine day-to-day camera line-up in the shortest possible time. Black, white, gray fields and black lines with different frequencies are positioned on a gray background. |
BBC65 |
| Double- Checker |
|
Double-Checker With the Siemens star TE148 on one side and the white balance sheet TE115 on the other, this target is a practical and essential tool for every cameraman. The neckband is a practical way to use it easily for the daily work. |
TE115 ATE148 16:9 A |
| TE83 |
|
ITE Grayscale Chart I (Gamma = 0.45) The TE83 is designed for evaluation of the halftone reproduction of electronic cameras. Two 11-graduated counter current gray scales are arranged on a gray background. The gray scales being graduated logarithmically (gamma = 0.45). |
TE83 ATE83 D |
| TE84 |
|
ITE Grayscale Chart II (Gamma = 1) The TE84 is designed for evaluation of the halftone reproduction of electronic cameras. Two 11-graduated counter current gray scales are arranged on a gray background. The gray scales being graduated logarithmically (gamma = 1.0) |
TE84 ATE84 D |
| T87 |
|
EIAJ TC B1 amplitude measurement chart , hatched The TE87 is designed to do video amplitude measurements. On a gray background there are white, gray and black patches in nine positions in the field. |
TE87 ATE87 D |
| TE88 |
EIAJ TC B2 amplitude measurement chart vertical The TE88 is designed to do video amplitude measurements. On a gray background there are white, gray and black patches in nine positions in the field. |
TE88 ATE88 D | |
| TE89 |
|
EIAJ TC F (edge effect measurement chart) The TE89 is designed to do edge effect measurements. In the center of the chart is a white cross surrounded by a large black area. |
TE89 ATE89 D |
| TE94 |
|
ITE Radial Resolution Chart The TE94 ist designed for checking resolution over the whole picture area. It consists of nine sector stars of 90 (black and white) sectors each. Resolution measurement with TV lines is independent from TV standard. |
TE94 ATE94 D |
| TE95 |
|
ITE Resolution Chart / EIAJ Test Chart A The TE95 test chart is designed for general (visual) appraisal of electronic cameras. It consists of circular figures, multibursts, vertical wedge-sharped rasters, diagonal lines and gray scales. |
TE95 ATE95 D |
| TE96 |
|
ITE Aperture Response Chart The TE96 is designed to measure aperture dependent resolution in the field. There are nine areas with frequencies from 30-1000 TV-lines in horizontal, vertical and diagonal directions. |
TE96 ATE96 D |
| TE97 |
|
High Resolution Universal Test Chart 1000 c/ph (= 2000 lines) The TE97 is designed for measuring and quick (most visual) appraisal of transmission characteristics of high resolution non-broadcast cameras. It contains amongst others gray scales, multibursts, resolution wedges with different frequencies (vertical and horizontal). |
TE97 ATE97 D |
| TE98 16:9 |
|
ITE High Registration Chart The TE98 is designed to do a geometrical camera alignment. It consists of one big center circle and eight circles in the field. Further on there are resolution wedges in nine positions horizontal/ vertical. |
TE98 ATE98 D |
| TE99 |
|
Multi Burst Test Chart (High-Class in Mega Cycle Chart) The TE99 is designed to measure frequency response of the modulation depth of electronic cameras. A line raster is arranged in the center of the test chart which produces frequencies of 0.5 to 10 MHz in the output of the TV camera. Bar rasters are located in the corners of the test chart and produce frequencies of 0.5 and 5 MHz. |
TE99 ATE99 D |
| TE100 TE100 16:9 |
|
Lens Focus Test Chart The TE100 is designed for the adjustment of camera lenses, checking back focal distance, checking resolution and establishing cushion and barrel distortion. It consists of a Siemens star, outlined arrows an several black an white linepairs. |
TE100 ATE100 16:9 A TE100 DTE100 16:9 D |
| TE101 |
|
Standard Test Chart The TE101 serves for general (visual) appraisal of TV cameras. The circular figures and the grid render possible a rough appraisal of the geometry. The wedge-shaped line rasters are used for visual appraisal of the resolution limit. The gray scales serve for evaluation of the halftone reproduction. |
TE101 ATE101 D |
| TE102 TE102 16:9 |
|
Chess Board Test Chart The TE102 test chart is designed for checking geometry, resolution and uniformity of signal generation. It is composed of black and white square fields. Two resolution wedges in the middle of the chart allow the checking of vertical and horizontal resolution. |
TE102 ATE102 16:9 A TE102 DTE102 16:9 D |
| TE103 |
|
Multi Burst Test Chart 1-6 MHz (positive) The TE103 is designed for resolution measurements, mainly for visual tests. It consists of eight rows with each six fields of multiburst of frequencies (1-6 MHz). |
TE103 ATE103 D |
| TE104 |
|
Multi Burst Test Chart 1-6 MHz (negative) The TE104 is designed for resolution measurements, mainly for visual test. It consists of four rows with each six fields of multiburst of frequencies (1-6 MHz). |
TE104 ATE104 D |
| TE105 |
|
Universal Test Chart The TE105 test chart is designed for general (visual) appraisal of 16:9 TV cameras. It consists of circular figures, gray scales, wedge-shaped line rasters, zone plates, a grid, diagonal and horizontal lines. |
TE105 ATE105 D |
| TE106 / N TE106 16:9 |
|
Color Bar Test Chart The TE106 is designed for checking the color rendition of TV cameras. The picture area is divided into six color bars showing the three primary colors red, green and blue and the secondary colors cyan, yellow and purple; in addition there is one bar of white and black. The succession corresponds to that of an electronically generated color bar. |
TE106 ATE106 16:9 A TE106 DTE106 16:9 DTE106N DTE106N 16:9 D |
| TE107 TE107 16:9 |
|
Multi Burst Test Chart (0-10 MHz) The TE107 is designed for checking the frequency response and the uniformity of modulation depth of electronic cameras. A line raster is arranged in the center of the test chart which produces frequencies of 0.5 to 10 MHz in the output of the TV camera. |
TE107 ATE107 16:9 A TE107 DTE107 16:9 D |
| TE108 |
|
Log. Gray Scale Test Chart (9 steps) The TE108 is designed for evaluation of the halftone reproduction of electronic cameras. Two 9-graduated counter current gray scales are arranged on a gray background. The gray scales being graduated logarithmically. |
TE108 ATE108 D |
| TE109 |
|
Log. Gray Scale Test Chart (5 steps) The TE109 is designed for evaluation of the halftone reproduction of electronic cameras. Two 5-graduated counter current gray scales are arranged on a gray background. The gray scales being graduated logarithmically |
TE109 ATE109 D |
| TE110 |
|
9 Sector Stars Test Chart (36 cycles) The TE110 is designed for adjustment of camera lenses, checking back focal distance and checking resolution over the picture area. The test chart consists of nine sector stars. Within the sector stars are two circular lines, which mark a 625 and a 312 line structure (525/ 262 in the NTSC version). |
TE110 ATE110 D |
| TE111B TE111B 16:9 |
|
Critical Flesh Tones Test Chart The flesh tone test chart is designed for evaluating the flesh tone rendition of electronic cameras. The picture shows portraits of three women with ideal and critical flesh tones. |
|
| TE112 |
|
Grid Test Chart TE112 is designed for operational adjustment and control of TV cameras. It consists of circles permitting rough visual appraisal of scan linearity, grid lines serving the purpose of adjusting registration and wedges serving the purpose of resolution appraisal. |
TE112 ATE112 D |
| TE113 TE113 16:9 |
|
Zone Plate With MHz-Grid The TE113 is designed for checking the resolution characteristics and “cross color” interferences of TV cameras and TV transmission systems. The test chart shows a zone plate over the whole image area where the spatial frequency of the rings has a linear increase towards the edges. The line grid marks the spatial frequency in vertical and horizontal direction. |
TE113 ATE113 16:9 ATE113 DTE113 16:9 D |
| TE114 |
|
Zone Plate Test Chart The TE114 is designed for checking the resolution characteristics and “cross color” interferences of TV cameras and TV transmission systems. The test chart shows a zone plate over the whole image area where the spatial frequency of the rings has a linear increase towards the edges. |
TE114 ATE114 D |
| TE115 TE115 16:9 |
|
White Balance Chart 70% Reflectance The TE 115 chart is designed for white balance. The density of the white area is 0.15 (based on BaO4S=0). This corresponds to a remission of 70%. |
TE115 ATE115 16:9 A |
| TE116 16:9 |
|
HDTV Grid Test Chart The TE116 is designed for operational adjustment and control of HDTV cameras. It consists of circles permitting rough visual appraisal of scan linearity, lines serve the purpose of adjusting registration and wedges serve the purpose of resolution appraisal. |
TE116 16:9 ATE116 16:9 D |
| TE117 16:9 |
|
HDTV Universal Test Chart The TE117 is designed for quick (mainly visual) appraisal of transmission characteristics of HDTV cameras. It consists of a gray background on which circles, gray scales, horizontal and vertical lines are positioned. |
TE117 16:9 A TE117 16:9 D |
| TE118 16:9 |
|
HDTV Resolution Test Chart (100 - 600 c/ph) The TE118 is designed for checking the resolution characteristics of HDTV cameras. On a black background five fields with different line rasters and black and white reference fields are arranged. The line rasters are inclined in different angles. |
TE118 ATE118 D |
| TE120 |
|
Sector Star Test Chart (36 cycles) The TE120 test chart is designed for adjustment of camera lenses and checking back focal distance. It shows a 36 sector Siemens star on white background. |
TE120 ATE120 D |
| TE121 |
|
Sector Star Test Chart (72 cycles) The TE121 test chart is designed for adjustment of camera lenses and checking back focal distance. It shows a 72 sector Siemens star on white background. |
TE121 ATE121 D |
| TE122 TE122 16:9 |
|
CCD Registration Test Chart The TE122 ist designed for measuring registration errors in a CCD camera. |
TE122 ATE122 16:9 ATE122 DTE122 16:9 D |
| TE123 |
|
100% Red The TE123 is designed for measuring the behaviour of the chrominance channel expressed as the signal-to-noise ratio. |
TE123 D |
| TE124 16:9 |
|
HDTV Resolution Test Chart (100 - 600 c/ph) The TE124 is designed for checking the resolution characteristics of HDTV cameras.The test chart with an aspect ratio of 16:9 shows nine blocks containing 42 resolution patterns each in the middle area. The corner fields have 20 resolution patterns. |
TE124 16:9 ATE124 16:9 D |
| TE125 16:9 |
|
HDTV Zone Plate Test Chart (600 c/ph, asymmetric) The TE125 zone plate test chart is particularly suited for the visual determination of the resolution of a high definition camera. It shows asymmetrically arranged one zone plate ranging from 0 to 600 c/ph and two zone plate sectors with their centers located in the left corners. The gore-shaped gaps are gray. |
TE125 16:9 ATE125 16:9 D |
| TE127 16:9 |
|
Log. Gray Scale Test Chart (9 steps) The TE127 is designed for evaluation of the halftone reproduction of electronic 16:9 cameras. Two 9-graduated counter current gray scales are arranged on a gray background. The gray scales being graduated logarithmically. |
TE127 16:9 ATE127 16:9 D |
| TE128 16:9 |
|
ITE High Resolution Chart The TE128 is designed for measuring and quick (most visual) appraisal of transmission characteristics of high resolution non-broadcast cameras. It consists of a gray background, a white circle, gray scales, multibursts, resolution wedges with different frequencies (vertical + horizontal) circular rings. |
TE128 16:9 ATE128 16:9 D |
| TE129 |
|
Black Pulse Bar Test Chart The TE129 is used to measure low and intermediate frequency response (streaking) and flare in video systems. On a white background a black rectangle (width equal to 25% of picture width; approx. 0.05 MHz) and a narrow black pulse (width equal to 1% picture width; approx. 1.25 MHz) are shown. |
TE129 ATE129 D |
| TE129 16:9 S |
|
Black Pulse Bar Test Chart (+ 2T pulse) The TE129 with an additional 2T-pulse in the middle of the black 25%-pw-pulse. |
TE129 16:9S ATE129 16:9S D |
| TE130 |
|
White Pulse Bar Test Chart The TE130 is used to measure low and intermediate frequency response (streaking) and flare in video systems. On a black background a white rectangle and a narrow white pulse are shown. |
TE130 A TE130 D |
| TE130 16:9 S |
|
White Pulse Bar Test Chart (+ 2T pulse) The TE130 with an additional black 2T-pulse in the middle of the white 25%-pw-pulse. |
TE130 16:9S A TE130 16:9S D |
| TE131 |
|
Auto Registration Chart (Sony Type) The TE131 is designed for use with cameras which have a single action auto-registration facility. |
TE131 ATE131 D |
| TE132 |
|
ISO Testpattern No. 2 (1 - 18 LP/mm, sheet with 12 patterns) This chart is designed to do resolution measurements. Five pairs of lines (black and white) with frequencies from 1-18 linepairs per millimeter are printed on a white background. The patterns are ordered counterclockwise in decreasing resolution on the chart. |
TE132 ATE132 D |
| TE133 |
|
Sector Star With Corner Line Pairs (36 cycles, 0.78 and 1.56 LP/mm) The TE133 consists of a Siemens star with 36 sectors. Vertical and horizontal grids are arranged at the edges of the test chart. The test grid provides an appraisal of the illustration quality of optical systems like cameras, lenses, microfilm systems and amplification equipment. |
TE133 A |
| TE134 |
|
Foucault-Miren 4-48 (0.5 - 6 LP/mm, sheet of 11 patterns) The test grid is designed for the appraisal of the illustration quality of optical system like cameras, lenses, microfilm systems, amplification systems and many more. It consists of 11 groups each with four line grids which are arranged in the angles of 45°, 0°, 135° and 90°. |
TE134 A |
| TE135 |
|
Multi Burst (Megacycle) Test Chart (0.5, 1, 1.5, 2, 2.5 , 3 , 5, 6 MHz) The test chart is designed for measuring amplitude frequency response of the luminance channel, i.e. the amplitude of the output signal relative to a reference level as a function of frequency. On a gray background a multiburst with different frequencies is shown. |
TE135 ATE135 D |
| TE136 |
|
USAF 1951 Target The TE136 is designed to do resolution measurements. It shows patterns - based on three black bars on white ground - in horizontal and in vertical direction. |
TE136 ATE136 D |
| TE137 |
|
Foucault Frequency Test 25-steps 2-0.5 LP/mm (set of 2 patterns) The TE137 is designed to do resolution measurements in a range of 2-0.5 linepairs per millimeter. Foucault patterns with horizontal, vertical and both types of diagonal resolution bw-bars are located in a matrix structure of 5 x 5 pattern on two different chart sheets |
TE137 A |
| TE138 |
|
Line pairs per cm (1-28.5 LP/cm, set of 10 pcs.) The TE138 is designed to do resolution measurements. Pairs of lines with frequencies from 1-28.5 linepairs per centimeter are printed on a white background. The patterns are ordered clockwise in decreasing resolution on the chart. |
TE138 A |
| TE140 |
|
Cine Resolution Test Chart (size A280 modified design) The TE140 is used for evaluating the resolving power of a cine camera. It consists of several Siemens stars and resolution patterns. |
TE140 A |
| TE142 |
|
Cine Standard (set of 10 x 3 pattern) reprographic paper, selfadhesive The TE142 is designed for evaluating the resolution power of the film. It shows nine vertical and nine horizontal groups of line pairs. The gradation of these line pairs follows the factor √2. |
TE142 A |
| TE143 |
|
ISO Test pattern No. 1 (sheet with 20 pattern; DIN 19051) The TE143 is designed to check the readability of the reproductions of documents. In pattern number 84 the direction of the two lines inside the octagon must be recognized without problems for seven out of eight symbols. |
TE143 A |
| TE144 |
|
Camcorder Resolution Test Chart The TE144 was developed in a private German testing laboratory and serves particularly for evaluating the frequency response of consumer camcorders. The test chart is subdivided into 18 horizontal fields of bar patterns with different frequencies. |
TE144 ATE144 D |
| TE145 |
Test Signal Test Chart, Line 17 The TE145 is designed for measuring several signal parameters according to the definitions set in CCIR Recommendation 569. It consists of a gray scale, a color gradient, gray and black bars different sizes. |
TE145 D | |
| TE146 |
|
Test Signal Test Chart, Line 18 The TE146 reproduces the test signal, line 18 as specified in CCIR recommendation 473. With the aid of measuring instruments test signals can be evaluated in a simple, and partly automatic way. It consists of a multiburst with different frequencies. |
TE146 ATE146 D |
| TE147 |
|
Test Signal TC, Line 18 with 0.2 MHz The TE147 reproduces the test signal, line 18, as specified in CCIR recommendation 473. With the aid of measuring instruments test signals can be evaluated in a simple, and partly automatic way. It consists of a multiburst with different frequencies. |
TE147 ATE147 D |
| TE148 16:9 |
|
Sector Star Test Chart (36 Cycles) The TE148 is designed for adjustment of camera lenses and checking back focal distance. It consists of a large Siemens star in the center and four smaller ones positioned in the corners of the test chart. |
TE148 16:9 A TE148 16:9 D |
| TE149 |
|
Universal Scanner Chart with ISO pattern No. 2 The TE149 is designed for assessment of the image quality of scanning devices. It is composed of five test arrays with ISO test pattern no. 2, horizontal and vertical mm measuring scales of 19 resp. 28 cm length, each two horizontal and vertical length marking of 120 mm and 5’’. |
TE149 ATE149 D |
| TE150 |
|
Universal Rotative Scanner Chart with ISO pattern No. 2 The test pattern is designed for assessment of the image quality of scanning devices. The test chart is composed of different patterns and grids. |
TE150 ATE150 D |
| TE152 |
|
Frequency Response TC (1-8 MHz continuously) The TE152 is designed for checking the frequency response of a camera. The test chart shows line rasters over the whole image area ranging from 1 to 8 MHz. |
TE152 ATE152 D |
| TE153 |
|
Log. Gray Scale Test Chart (11 steps) The TE153 is designed for evaluation of the halftone reproduction of electronic cameras. Two 11-graduated counter current gray scales are arranged on a gray background. The gray scales being graduated logarithmically. The contrast range of the gray scales is 40:1. |
TE153 ATE153 D |
| TE155 |
|
Window Test Chart 3/10 picture height (IEC 61146) The TE155 is designed for evaluating the degree of the spurious image that remains after removing the still subject being shot. Therefore the black test chart has a transparent square in the center. |
TE155 ATE155 D |
| TE156 |
|
Window Test Chart 1% (IEC 61146) The TE156 is designed to measure blooming and smearing effects of CCD cameras. The transparency consists of a black area with a white (transparent) area. The transparent area has 1% of the picture area, marked by the white arrows. |
TE156 ATE156 D |
| TE157 |
|
Radial Resolution Test Chart (IEC TC 84) The TE157 is designed for checking radial resolution of cameras. It shows a sector star with 180 sectors. One sector corresponds to an angel of 2° and has a black and a white beam. |
TE157 ATE157 D |
| TE158 |
Cine Test Chart with format markings for 1:1375 (35 mm), 1:166 (S16), 16:9 (HDTV), 1:185,1:2. Resolution power is given for three different enlargements The TE158 is designed for evaluating the image quality of film cameras and can be used for cameras of different formats. It consists of sector stars, several test elements, a linear gray scale, and a nine testcolor patch. |
TE158 A | |
| TE159 |
|
Sinusoidal Multi Burst Test Chart (IEC 61146) The TE159 is designed for measuring horizontal static resolution. It shows vertical bars, the density variation of which gives a sinusoidal video response. |
TE159 D |
| TE161 |
|
Sector Star Test Chart (72 cycles) The TE161 test chart is designed for adjustment of camera lenses and checking back focal distance. It consists of a large Siemens star in the center and four smaller ones positioned in the corners of the test chart. |
TE161 ATE161 D |
| TE162 |
|
Chrominance Responce Test Chart (IEC 61146) The TE162 is designed to measure the amplitude frequency response of the chrominance channels. The test chart is a color multi-burst pattern, covering a spatial frequency range from 100 kHz to 1.5 MHz. |
TE162 ATE162 D |
| TE163 |
|
Black and White Test Chart The TE163 is designed for measuring the contrast range of electronic cameras. The test chart shows two picture halves in neutral gray and black. The contrast range of both picture halves is 40:1. |
TE163 ATE163 D |
| TE165 16:9 |
|
Log. Gray Scale Test Chart (11 steps) The TE165 is designed for evaluation the halftone reproduction of 16:9 electronic cameras. Two 11-graduated counter current gray scales are arranged on a gray background. The gray scales being graduated logarithmically. The contrast range of the gray scales is 40:1. |
TE165 16:9 ATE165 16:9 D |
| TE166 16:9 |
|
Grid Test Chart The TE166 is designed for operation alignment and checking of electronic cameras. The circular lines allow a rough visual appraisal of the geometry. The grid lines serve for adjusting registration errors. The wedges are used for assessment of the resolution. |
TE166 16:9 A TE166 16:9 D |
| TE167 16:9 |
|
HDTV Universal Test Chart The TE167 test chart is designed for general appraisal of HDTV cameras. It consists of gray scales, circular figures, a grid, sector stars, multibursts and resolution wedges. |
TE167 16:9 ATE167 16:9 D |
| TE169 |
|
EBU/CAM Test Chart (EBU Tech. 3237) TE169 is designed to measure color reproduction. The chart consits of 18 color patches and six patches from white to black. |
TE169 A |
| TE170 |
|
Electronic Still Picture Resolution Chart (ISO 12233) The TE170 chart is designed to measure resolution of still cameras. It contains resolution wedges up to 2000 lines per picture heigt. Furthermore it contains slanted edges for SFR measurements. |
TE170 ATE170 D |
| TE173 TE173 16:9 |
|
Aliasing Test Chart The TE173 is designed for measuring aliasing. The test chart consists of rectangular bars which spatial frequencies depend on the picture width used. |
TE173 ATE173 16:9 A TE173 D TE173 16:9 D |
| TE174 |
|
Registration Measurement Test Chart The TE174 is designed for determining the relative horizontal and vertical offset which can exist between the primary R, G, B signals. The test chart has 14 horizontal and 19 vertical black lines (width of 1.3% of the picture height) on a white background. |
TE174 ATE174 D |
| TE175 |
|
Streaking Measurement Test Chart The TE175 is designed for measurement of the disturbance caused to the video level in black areas to the right of or below the areas. Horizontal white lines are positioned on a black background. |
TE175 ATE175 D |
| TE176 TE176 16:9 |
|
Resolution Test Chart (Depth of modulation IEC 61142) The TE176 is designed for measuring resolution of electronic cameras. The test chart consists of alternating black and white bars with sharp transition. Two groups of bars with video frequencies of 0.5 and 5 MHz are distributed over the picture area. |
TE176 ATE176 16:9 A TE176 DTE176 16:9 D |
| TE178 |
|
Blank Film The TE178 is a white balacing test chart. |
TE178 D |
| TE179 |
|
Registration Test Chart (IEC 61146) The TE179 is designed to measure registration of video cameras. |
TE179 ATE179 D |
| TE180 |
|
Ikegami CPU-Chart The IKEGAMI CPU-Chart is determined for setting up all IKEGAMI cameras which are switchable between 4:3 and 16:9 aspect ratio. Two 3-graduated counter current gray scales are arranged on a gray background with grid structure. |
TE180 ATE180 D |
| TE182 TE182 16:9 |
|
Neutral Gray 18% remission The TE182 is an 18% gray test chart |
TE182 ATE182 16:9 A TE182 DTE182 16:9 D |
| TE183 |
|
19/14-Grid Test Chart (IEC 84/60B) The TE183 is designed for operational adjustment and control of TV cameras. A grid structure is arranged on a white background. The grid permits rough visual appraisal of scan linearity and the lines serve the purpose of adjusting registration. |
TE183 A TE183 D |
| TE185 |
|
Ikegami Set Up Test Chart (HK 322) The TE185 is designed for automatical setup of Ikegami cameras |
TE185 ATE185 D |
| TE186 |
|
Ikegami Auto Geometry Chart The TE186 is designed for automatical geometrical setup of Ikegami cameras. |
TE186 ATE186 D |
| TE187 |
|
Grid Test Chart (EIAJ test chart I) The TE187 is designed for operational adjustment and control of TV cameras. It consists of circles permitting rough visual appraisal of scan linearity, a grid structure serving the purpose of adjusting registration and resolution wedges serving the purpose of resolution appraisal. |
TE187 ATE187 D |
| TE188 TE188 16:9 |
|
Color Rendition Chart (X-Rite ColorChecker) The TE188 was designed with respect of the well- known 'ColorChecker'. Used in photography, film and TV, the chart consists of 18 color patches and a 6-step gray scale. |
TE188 A280 TE188 16:9 A280 TE188 A460 TE188 16:9 A460 TE188 DTE188 16:9 D |
| TE192 |
|
Saw Tooth Signal Test Chart The TE192 is designed for cameras without an integrated electronic saw tooth signal. It allows the gamma correction of the camera to be visualized on the oscilloscope. It shows a linear continuous progression from 0% to 100% transmission set on a gray background. |
TE192 ATE192 D |
| TE194 |
Aliasing Test Chart The TE194 is designed for measuring aliasing. The chart consists of eight rows of rectangular bars with the spatial frequencies of 1, 2, 4, 6, 8, 10, 12 and 14 MHz. |
TE194 ATE194 D | |
| TE195 |
|
Ikegami CPU Test Chart The TE195 is designed for automatical setup of Ikegami cameras. |
TE195 ATE195 D |
| TE197 16:9 |
|
OECF Test Chart contrast (ISO 14524) 20:1, 80:1, 160:1, 1000:1, 4000:1 The TE197 is designed for evaluating the opto-electronic-conversion-function of a camera. The chart consists of a circular ordered 12-step-gray scale on a gray background. |
TE197 A 20:1TE197 D 20:1TE197 A 80:1 TE197 D 80:1TE197 A 160:1 TE197 D 160:1 TE197 D 1000:1 TE197 D 4000:1 |
| TE199 |
|
Multi Burst TC 0.1-7.0 MHz in 0.1MHz steps The TE199 is designed for acurate resolution measurement. The chart consists of six rows with each ten fields of rectangular bursts. |
TE199 ATE199 D |
| TE200 |
|
Sony HDTV Set Up Test Chart The SONY HDTV Setup Test Chart is determined for setting up all Sony cameras which are switchable between 4:3 and 16:9 aspect ratio. It consists of a gray background with grid structure and two 3-step-gray scales in center of the chart. |
TE200 ATE200 D |
| TE201 |
|
Ikegami Set Up Test Chart (for older camera types) The TE201 is designed for automatical setup of Ikegami cameras. |
TE201 ATE201 D |
| TE202 |
|
Sector star 20 Cycles The TE202 is designed for adjustment of camera lenses and checking back focal distance. |
TE202 ATE202 D |
| TE203 TE203 16:9 |
|
Double Saw Tooth Test Chart (digital signal quantisation) The TE203 is designed to check cameras for quantization errors. It consists of a high and low contrast saw tooth. |
TE203 D |
| TE204 16:9 |
|
Sinusoidal Multi Burst Test Chart (1-10 MHz) The TE204 is designed to measure resolution of cameras. It contains sinusoidal multiburst patterns from 0.5-10 MHz. |
TE204 16:9 D |
| TE205 |
|
Gamma Measurement Test Chart The TE205 is designed to check the gamma setting of the camera. The chart shows ten gray steps from 1-10% transmission and ten gray steps from 10-100% transmission. |
TE205 D |
| TE206 |
|
Flare Test Chart (Thomson No. 29299905) The TE206 is used to measure flare of camera systems. A black rectangle is surrounded by a large white area. |
TE206 ATE206 D |
| TE207 |
Resolution Test Chart (Thomson No. 4150089) The TE207 is designed to measure resolution. It consists of multiburst patterns from 0.5-6.67 MHz in the center and the corners of the image. |
TE207 ATE207 D | |
| TE209 |
|
Cine Color Test Chart The test chart is composed of the three primary colors Red, Green and Blue and the secondary colors Yellow, Purple and Cyan. |
TE209 A |
| TE210 |
|
Cine Neutrality Test Chart The TE210 is mainly designed for assessment of the neutrality of color reproduction. The test chart shows in its center a field of neutral gray with 18% reflectance and at its sides two small fields each with white of 90% and black of 3% reflectance. |
TE210 A |
| TE211 |
|
Cine Gray Scale Chart (6 Steps) The TE211 is designed for evaluating the brightness rendition and the neutrality of color rendition of cine cameras. Inside a white frame corresponding to the S16 aspect ratio six neutral gray fields are arranged. Their brightness is graded in a way to correspond to one lens stop each. |
TE211 A |
| TE212 |
|
Cine Stability Test Chart The TE212 is designed for evaluating the picture stability of film cameras. |
TE212 D |
| TE213 |
|
Cine Format Test Chart (S16 / N16) Picture Stability The TE213 is used to set up film cameras and scanners. In the center is a Siemens star for focusing and there are several frames marked for different film formats. |
TE213 A |
| TE214 |
|
Color Rendition Test Chart (IEC 61146) The TE214 is designed for assessment of the color rendition of electronic cameras. It consists of a neutral gray background, a white field, a black field (super black hole) with a remission of < 0.5% and a second black field, where color patterns may be applied alternatively. |
TE214 ATE214 D |
| TE215 |
|
Blooming Test Chart (IEC 61146) The TE215 is designed to measure the blooming effect of an electronical video camera. Therefore the black test chart contains a small rectangular window. |
TE215 ATE215 D |
| TE216 |
|
Moiré Test Chart (IEC 61146) The TE216 is designed for determining the degree of crosstalk of FM-luminance sidebands into the down-converted chrominance band, being demodulated as unwanted color signals (the socalled 'cross-color'). |
TE216 ATE216 D |
| TE217 |
|
Y-C-Offset Test Chart (IEC 61146) The TE217 is designed to measure the Y-C-offset. It contains a black center area surrounded by white space and four green patches around that on a gray background. |
TE217 D |
| TE218 |
|
Autofocus Test Chart Set (IEC 61146) The TE218 is designed to check the autofocus system of a camera. It consists of two different sizes of Siemens stars. |
TE218 A |
| TE219 |
|
Noise Measurement Test Chart (ISO 15739) 20:1, 80:1, 160:1, 1000:1 The TE219 is designed for noise measurement of still video. It consists of circular and horizontal positioned gray fields, one gradient field and one field containing a diagonal multiburst with different frequencies. |
TE219 A 80:1TE219 D 80:1TE219 A 1000:1 TE219 D 1000:1TE219 D 160:1 |
| TE220 |
|
Back Focus Test Chart (36 cycles with corner stars) The TE220 is designed for adjustment of camera lenses and checking back focal distance. It consists of a large Siemens star in the center an four smaller ones positioned in the corners of the test chart. |
TE220 ATE220 D |
| TE221 |
|
Scanner Color Test Chart (IEC 61966-8) The TE221 is designed to calibrate the color reproduction of a scanner. 264 color patches and 22 gray patches are on the chart. |
TE221 A |
| TE222 16:9 |
|
HDTV Color Resolution Test Chart The TE222 is designed to measure color resolution of HD cameras. R, G, B, BY and MC multiburst patterns from 2 MHz to 20 MHz are on the chart |
TE222 16:9 ATE222 16:9 D |
| TE223 16:9 |
|
HDTV Log. Gray Scale Test Chart, 13 steps, contrast 1:200 The TE223 is designed for evaluation of the halftone reproduction of electronic cameras. Two 13-graduated counter current gray scales are arranged on a gray background. The gray scales being graduated logarithmically. |
TE223 16:9 ATE223 16:9 D |
| TE224 16:9 |
|
HDTV Resolution Test Chart The TE224 is designed to measure and describe the frequency response of an electronic HDTV camera. The test chart consists of 50 multi burst fields, which are distributed over a 16:9 picture area. The fields are arranged in horizontal and vertical direction to measure resolution in both directions. |
TE224 16:9 ATE224 16:9 D |
| TE225 16:9 |
|
HDTV Resolution Test Chart The TE225 is designed to measure and describe the frequency response of an electronic HDTV camera. The test chart consists of 32 multi burst fields, which are distributed over 16:9 picture area. The fields are arranged in horizontal and vertical direction to measure resolution in both directions. |
TE225 16:9 ATE225 16:9 D |
| TE226 16:9 |
|
HDTV Color Rendition Test Chart The TE226 is designed for evaluation color rendition of HDTV cameras. The chart consists of 36 color patches and a 9-step gray scale. Besides the primary and secondary colors the test chart contains mainly colors, which are critical in reproduction, e.g. dark and light skin tones, foliage, blue sky, orange, violet and others. |
TE226 16:9 D |
| TE229 |
|
Color Key Test Chart The TE229 is designed to check colors of a camera. A circle of 30 different colors and four patches with the colors white, gray, green and blue are on the chart. |
TE229 A |
| TE230 |
|
X-Rite Color Checker SG The Digital ColorChecker Semi Gloss (SG) is specifically designed to meet the needs of digital photography. It consists of 140 patches, includes standard ColorChecker, skin-tone reference colors and gray scale steps. |
TE230 A |
| TE231 N 16:9 |
|
HD Sweep Test Chart The TE231 is designed for checking the frequency response of HDTV cameras. The test chart shows line rasters over the whole image area ranging from 100 to 1200 lines. |
TE231 16:9 D |
| TE232 16:9 |
|
Log. Gray Scale/Color Test Chart 16:9 (super black hole in folders) The TE232 is designed for evaluation of the halftone and color reproduction of electronic cameras. Two 11-graduated counter current gray scales are arranged on a gray background (graduated logarithmically) and two color patches representing the three primary colors as well as the three secondary colors. |
TE232 16:9 A |
| TE233 16:9 |
|
Color Chart with 24 colors and 4 skin tones The TE233 serves for measuring the color reproduction of HD cameras, for selective color correction and for making color reference shootings for post production. The chart is composed of color patches including the three basic colors, the secondary colors and patches with four skin tones. |
TE233 16:9 A |
| TE234 16:9 |
|
Color Gradation Test Chart The TE234 consists of different color grades. It is used to check quantization errors which results in visible steps in the grades. |
TE234 16:9 A |
| TE235 |
|
Surveillance Camera Test Chart The TE235 servers for on-site testing of surveillance cameras. The chart roughly corresponds to the size of a person. It consists of different line pairs, a sector star, a gray scale and color fileds. It is supplied with a tripod which allows the chart to be tilted and turned by 360°. |
TE235 A |
| TE236 16:9 |
|
Lens Breathing Test Chart The TE236 is designed to measure lens breathing. This means a change of the focal length (the reproduction scale of the scene) of the lens just by changing the focus point. It contains three white vertical stripes on a black background. |
TE236 16:9 A |
| TE237 |
|
High Resolution Sector Star Test Chart The TE237 serves for checking resolution over the whole picture area. It consists of sector stars of 72 (black and white) sectors. |
TE237 ATE237 D |
| TE239 16:9 |
|
HDTV In Mega Cycle Test Chart The TE239 is designed for checking the frequency response of modulation depth and the uniformity of modulation depth of HDTV cameras. The test chart consists of multi burst fields, which are distributed over a 16:9 picture area.The fields are arranged in horizontal and vertical direction to measure resolution in both directions. |
TE239 16:9 ATE239 16:9 D |
| TE240 |
|
ISO 21550 Scanner Dynamic Range Chart The TE240 is designed to check 35 mm-scanner dynamic range. It has 24 gray-patches with a density range of 4.0 or 6.0. |
TE240 D |
| TE241 16:9 |
|
OECF/Noise Chart with 20 gray patches 10000:1 (ISO 14524, ISO 15739) The TE241 is designed to measure the characteristic curve of digital cameras. It is an extended OECF chart and has 20 patches and a contrast range of 10000:1 or if needed 100000:1. |
TE241 16:9 D |
| TE244 |
|
IE Pattern Resolution The TE244 is designed to check aliasing behavior of digital cameras. |
TE244 ATE244 D |
| TE245 |
|
IE Landolt Circle Resolution The TE245 is designed to make a visual resolution analysis of digital cameras. It contains Landolt circles in different sizes. |
TE245 ATE245 D |
| TE246 16:9 |
|
4 Quadrant Sector Star The special star consists of four segments each with a different number of cycles. So it is possible to focus the wide angle and the tele position in an optimal adjustment of the focusing point. This is essential for positioning the flange focal distance without a special collimator. |
TE246 16:9 ATE246 16:9 D |
| TE248 16:9 |
|
Distortion Grid The TE248 is designed to measure disortion of digital cameras. It contains a fine grid of black lines on white background. |
TE248 16:9 ATE248 16:9 D |
| TE249 16:9 |
|
Scale to measure macro capabilities The TE249 is designed to determine the macro capabilities of a camera-lens system. |
TE249 16:9 ATE249 16:9 D |
| TE250 |
|
USAF resolution test chart 35mm USAF resolution test chart on Film in 35mm . Useable for Scanner resolution up to 10000 ppi. |
|
| TE251 16:9 |
|
Distortion and Chromatic Aberration, Crosses The TE251 is designed to measure disortion of digital cameras. It contains black crosses on white background. |
TE251 16:9 ATE251 16:9 D |
| TE252 |
|
CIPA Resolution Target The TE252 is designed to measure resolution of digital cameras. It is described in the CIPA standard. |
TE252 ATE252 D |
| TE253 |
|
Modulated Sinusoidal Siemens Star The TE253 is designed for checking resolution. The chart contains a radially sine modulated Siemens star in the center of the image, gray patches and black squares with a small white square in it. |
TE253 A |
| TE253 9x |
|
Modulated Sinusoidal Siemens Star Set of 9 stars arranged in 3 columns |
TE253 A |
| TE255 |
|
Diffusor Plate to measure vignetting The TE255 is designed to measure shading/vignetting of a digital camera. It is a very precise milk glass palte which is used in combination with an integration sphere or a light box. |
TE255 D |
| TE256 16:9 |
|
Color and Calibration Test Chart revised Version of TE232 (super black hole in folders) The TE256 is designed to color align HD cameras. |
TE256 A |
| TE258 |
|
IT8 Scanner Characterization Chart The TE258 is designed to characterise slide/ print scanners. It is suitable to create color management profiles for scanners. |
TE258 |
| TE259 |
|
OECF/Noise Chart with 20 gray patches contrast 10000:1 The TE259 is designed to check the dynamic range of broadcasting cameras on a waveform monitor. It contains a gray step wedge with 20 patches and a contrast range of 10000:1. |
TE259 D |
| TE260 16:9 |
Dot Chart The 'dot' chart consists of two different charts on the front side and the back side. One of them has 31 lines of dots and the other 15 lines of dots. They can be used to determine distortion and chromatic aberration. |
TE260 A | |
| TE261 16:9 |
Slanted Edges This target has a tilted chequerboard in the background and five low contrast slanted edges together with surrounding gray patches in the front. It is used to determine the SFR of digital capture devices and is our default chart in combination with the AF-Box and STEVE. |
TE261 A | |
| TE262 |
|
Universal Test Target (UTT) The Universal Test Target is designed to evaluate the image quality of scanners and oher digital input devices used to create digital images of documents, photos and other reflective media. |
|
| TE263 |
|
Scan Reference Chart The chart consists of gray steps, color patches, a scale and resolution pattern. It allows automatic analysis of each scanned page and - in combination with the right software - provides information for the reason if a specific page happens to be out of specs. |
|
| TE264 16:9 |
|
OECF 20 ISO 14524 / 15739 revision The former OECF chart contains 12 or 20 gray patches in a circular order and three different patterns in the center of the chart. The actual version of the OECF chart skips the center patches due to sometimes occurring straylight. This chart is also offered as TE264X where the 20 gray patches are not rasterized like in the standard version of the chart but done with nearly no structure on a very fine grained film. |
TE264 D 10000:1TE264 D 10000:1TE264X D |
| TE265 |
|
Dead Leaves This chart contains so called dead leaves (in this case circles) structure. The structure is made of circles in all sizes and gray levels. A fourier transform of an image of this structure taken with a camera provides the power spectrum that the camera is able to reproduce. |
|
| TE266 |
|
Microfilm Target DIN 19051 The DIN 19051 provides a test chart to calibrate a microfilm production chain. They can be mounted on a plastic backing to put on a table or hung up on whatever kind of mounting is available. In contrast to the existing standard our new default chart TE266 will use the line pair target known as ISO 19051 pattern No 2 because it is more intuitive to evaluate and more widely used. But on request Image Engineering offers the original version with ISO 19051 pattern No 1. |
|
| TE268 |
|
Lens Resolution Test Chart The TE268 is made for resolution and sharpness measurements. 25 sinusoidal modulated siemens stars, 16 slanted edges at four different contrasts, four colored dead leaf structures and rope structure images are placed on the chart. A very detailed analysis over nine different image heights is possible with this chart. |


Copyright ? 1998-2025深圳市天友利標準光源有限公司 旗下123儀器網 版權所有
主要產品系列:色差計,色差儀,國產進口色差計,便攜式色差計,手持式色差計,標準光源對色燈箱,分辨率測試卡,色卡
12317儀器誠信聯盟核心成員 站點地圖
![]()